‼️ This blog kicks off a new mini-series focused on DevOps security in Microsoft Defender for Cloud. We’ll cover how to embed security scanning into your pipelines, explore the new Defender for Cloud CLI, and look at gated deployments for Kubernetes. You don’t need any prior experience, just a willingness to learn.
Most security teams are still finding out about misconfigurations after they’ve hit production. A storage account goes public, a container image ships with a critical CVE, an IaC template deploys an open NSG. By the time Defender for Cloud generates the recommendation, the damage window is already open. Fixing issues before they hit production is both cheaper as it reduces “re do“ and safer if misconfigurations are caugfht early its less attack surace.
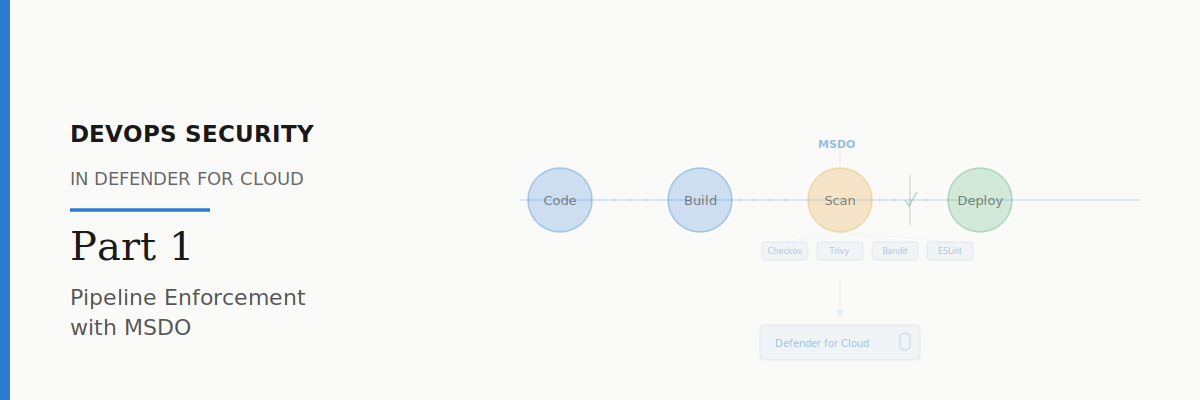
The fix is to shift security left. Not as a buzzword, but as a practical pipeline step. Microsoft Security DevOps (MSDO) is how you do that inside Defender for Cloud. It’s a pipeline extension that runs security scanners against your code, templates, and dependencies during your CI/CD build — before anything reaches production.
In this post, I’ll walk you through what MSDO is, how it works, how to set it up in Azure DevOps and GitHub, and what value it gives you back inside Defender for Cloud.
What is MSDO?
Microsoft Security DevOps (MSDO) is a pipeline extension (for Azure DevOps) and a GitHub Action that orchestrates a set of open-source security scanners. When it runs as part of your CI/CD pipeline, it scans your code and produces results in SARIF format (Static Analysis Results Interchange Format). Those results are then published as a pipeline artifact and ingested into Defender for Cloud.
The scanners that MSDO orchestrates include tools like Bandit (Python SAST), BinSkim (binary analysis), Checkov (IaC scanning), ESLint (JavaScript/TypeScript), Template Analyzer (ARM/Bicep), Terrascan (IaC), and Trivy (container and dependency scanning). You can run all of them or pick specific ones depending on your stack.
The key thing to understand is that MSDO doesn’t replace these tools. It wraps them into a single, consistent pipeline step with unified output. One task, multiple scanners, one SARIF artifact that Defender for Cloud understands.
Why This Matters
Without MSDO, your security recommendations in Defender for Cloud are reactive. A misconfigured resource gets deployed, CSPM detects it, a recommendation is generated, and someone has to go fix it. That loop can take days or weeks.
With MSDO, you catch the problem at build time. A Terraform template with an open security group gets flagged before it ever reaches Azure. A container image with a critical CVE gets caught before it’s pushed to your registry. The developer sees the finding in their pipeline logs and can fix it in the same PR.
And because MSDO publishes results to Defender for Cloud, security teams get visibility into what’s being caught at the pipeline level. You can see DevOps findings in the DevOps security blade, correlate them with cloud resources, and track remediation. It’s the bridge between your development workflow and your security posture.
Setting Up MSDO in Azure DevOps
Let me walk you through the setup step by step.
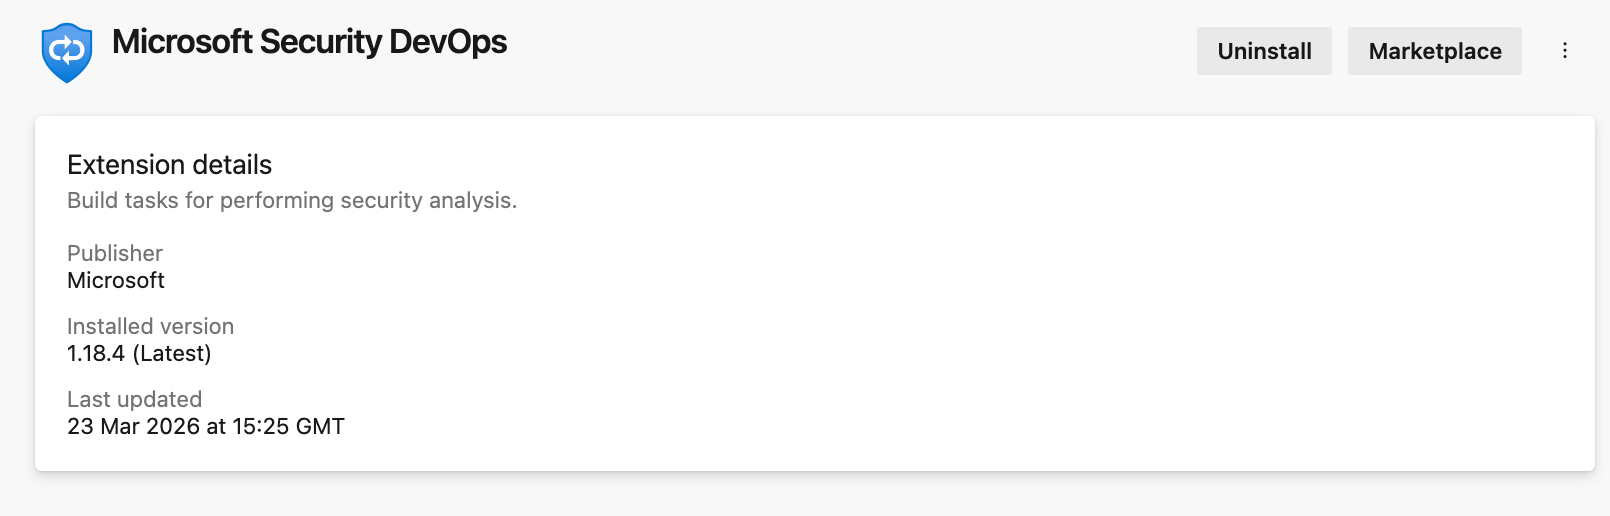
Step 1: Install the Extension
First, you need to install the Microsoft Security DevOps extension in your Azure DevOps organisation. Go to your Azure DevOps organisation, click the shopping bag icon in the top-right, and select Manage extensions. Search for “Microsoft Security DevOps” in the marketplace, select it, and install it for your organisation. You’ll need Project Collection Administrator privileges to do this.
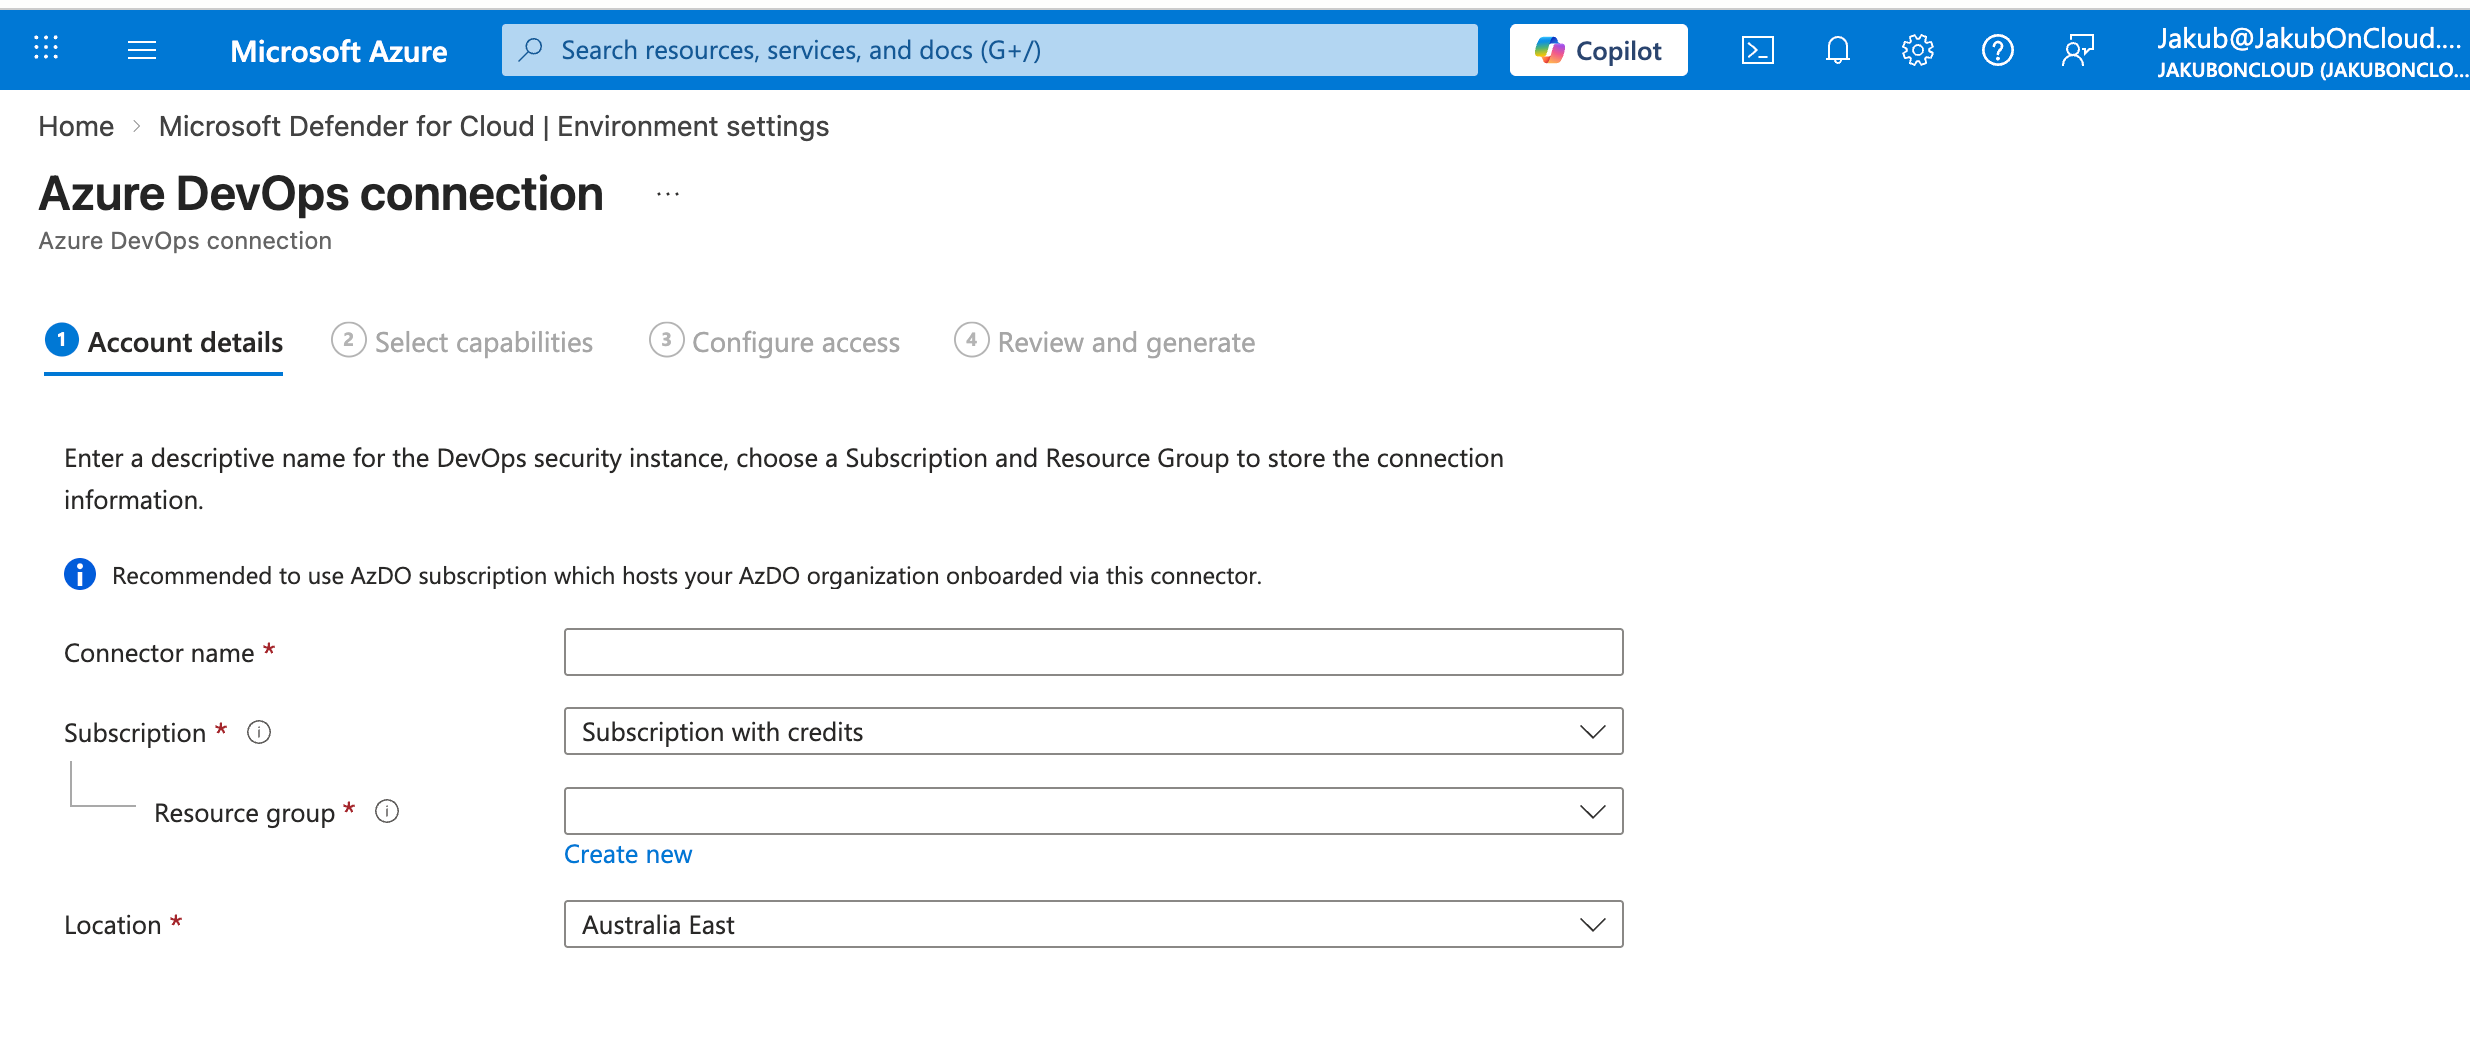
Step 2: Connect Azure DevOps to Defender for Cloud
If you haven’t already, you need to connect your Azure DevOps organisation to Defender for Cloud. In the Azure portal, go to Microsoft Defender for Cloud > Environment settings > Add environment > Azure DevOps. Follow the wizard to authorise the connection.
Once connected, Defender for Cloud can ingest the SARIF results from your pipelines and surface findings in the DevOps security blade.
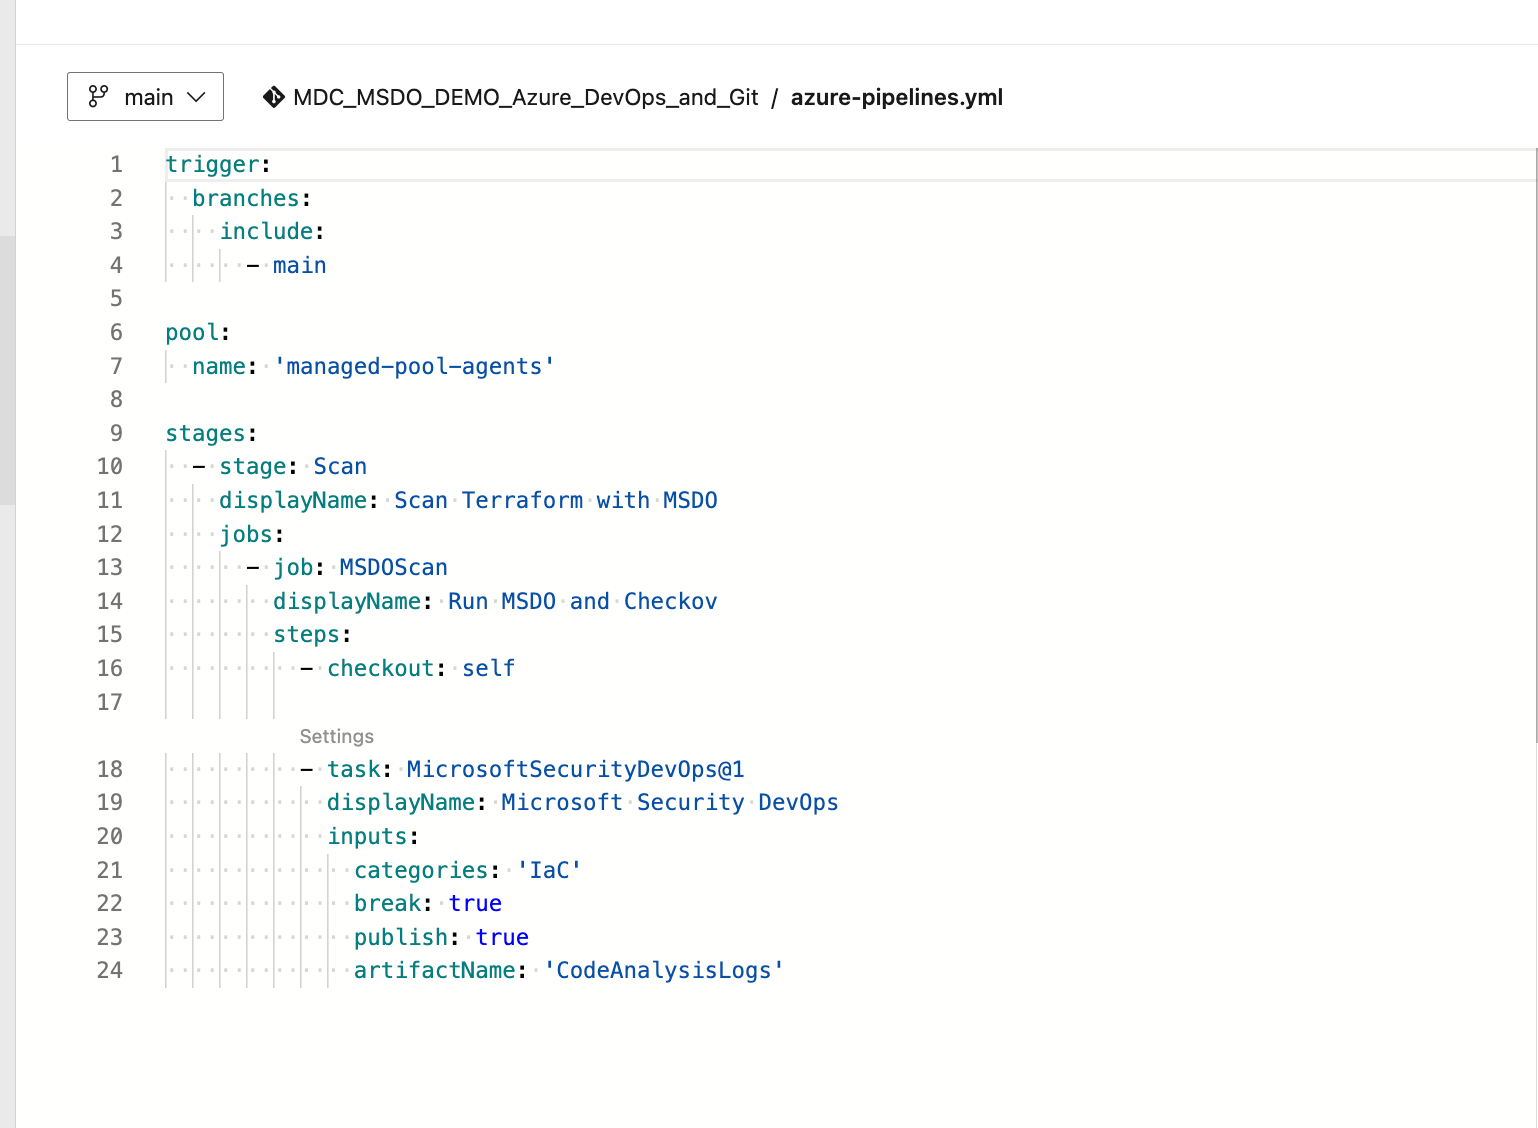
Step 3: Add the MSDO Task to Your Pipeline
Now add the MSDO task to your pipeline YAML. Here’s a minimal example:
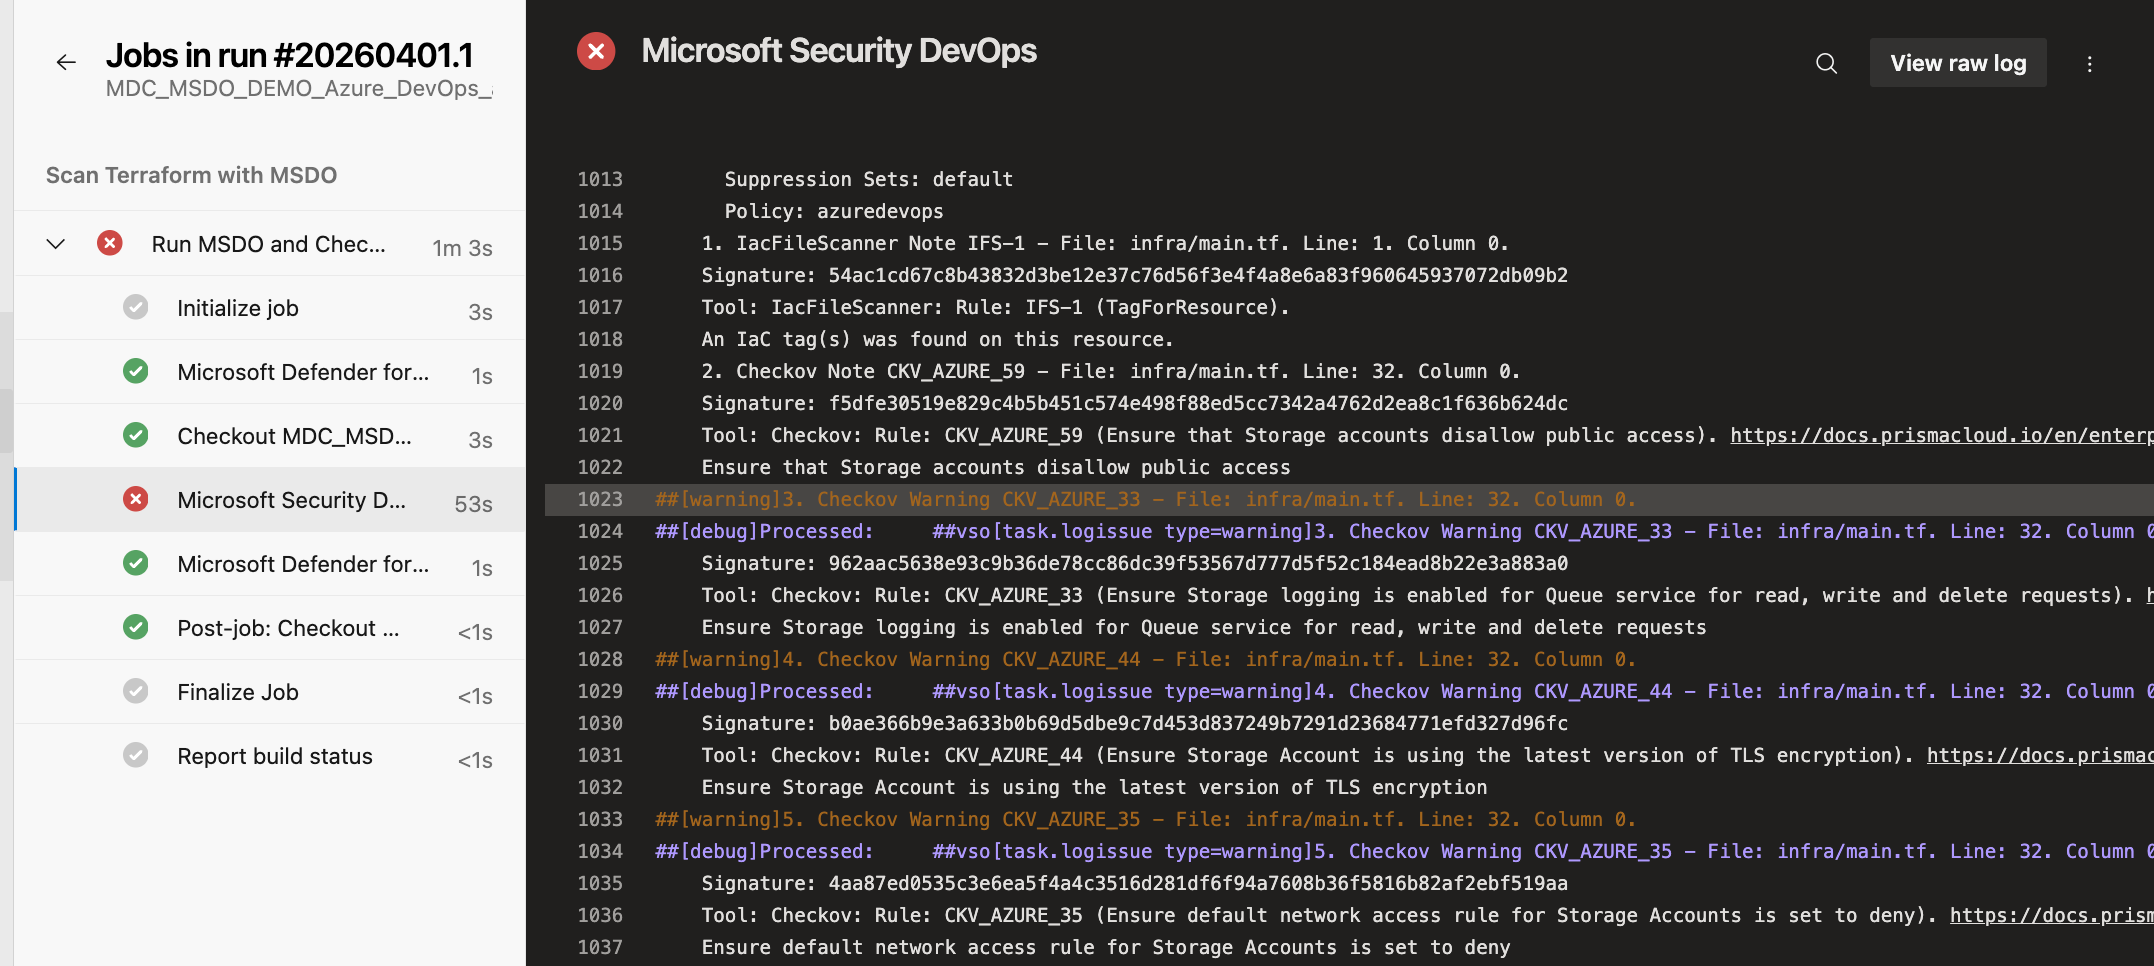
Trigger a pipeline run. When it completes, you’ll see the MSDO step in the pipeline logs. Click into it to see the individual scanner results. Each finding includes the file, line number, severity, and a description of the issue.
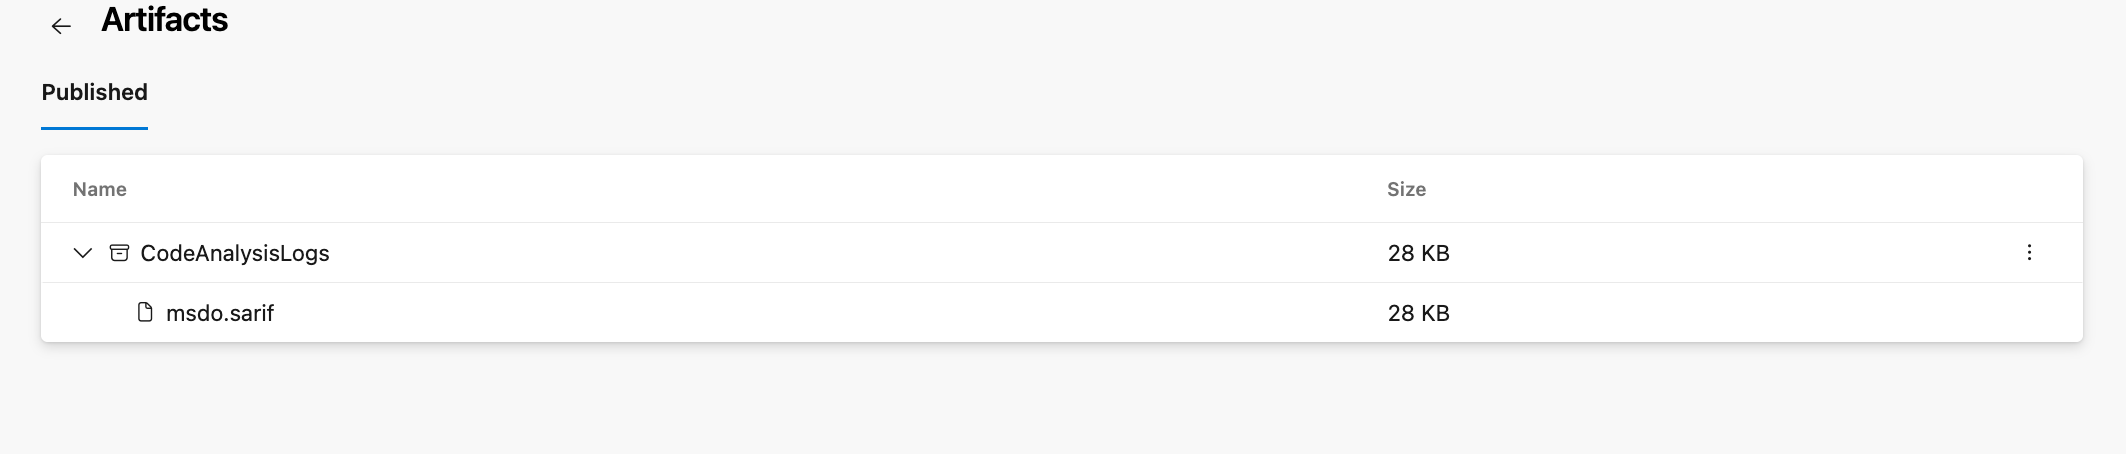
The SARIF results are also published as a pipeline artifact under CodeAnalysisLogs. This is the artifact name that Defender for Cloud looks for when ingesting results.
Step 5: See Findings in Defender for Cloud
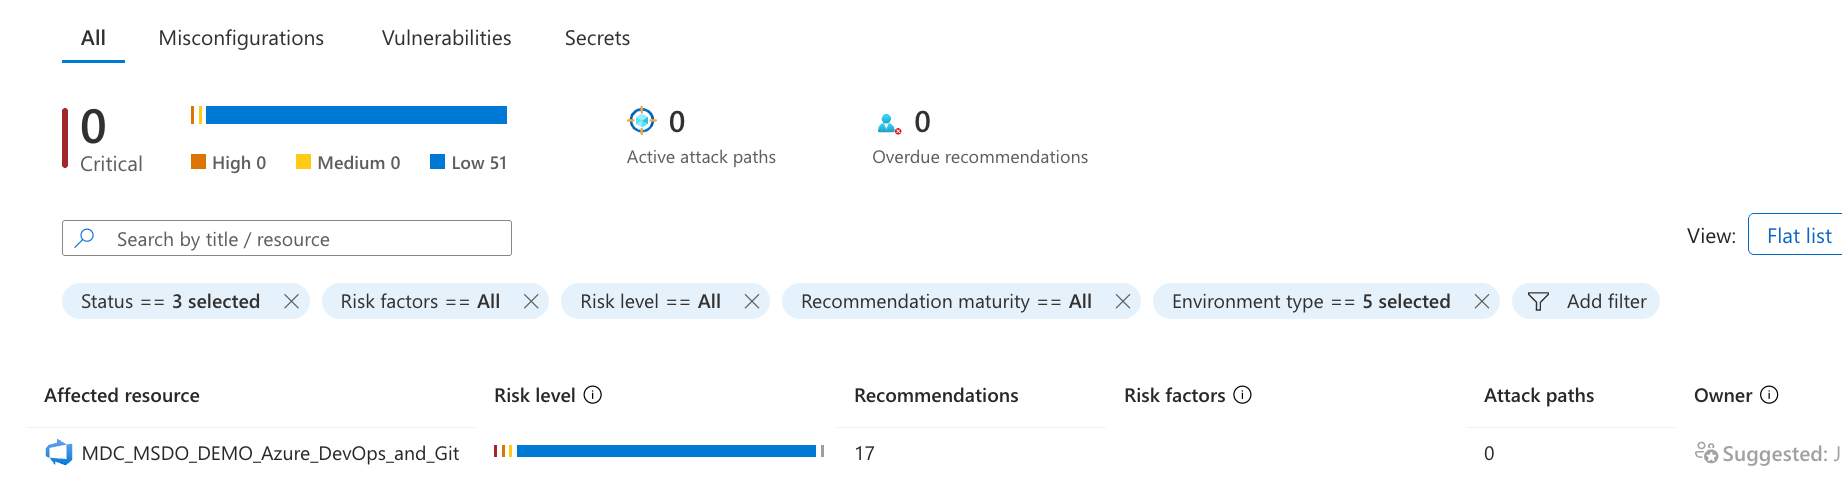
After the pipeline runs, navigate to Microsoft Defender for Cloud > DevOps security in the Azure portal. You should start seeing findings within minutes. The DevOps security blade shows your onboarded repositories, their security findings (code, secrets, dependencies, IaC), and the total count broken down by severity.
Click into a repository to see the individual findings. Each finding links back to the affected file and includes remediation guidance.
Setting Up MSDO in GitHub
For GitHub, the process is similar but uses a GitHub Action instead of an Azure DevOps task.
Step 1: Connect GitHub to Defender for Cloud
In the Azure portal, go to Microsoft Defender for Cloud > Environment settings > Add environment > GitHub. Authorise the connection to your GitHub organisation.
Step 2: Add the GitHub Action
Create a workflow file in your repository (e.g., .github/workflows/msdo.yml):
The key permissions are contents: read and id-token: write — the id-token permission is required for federation with Defender for Cloud. The artifact name must be CodeAnalysisLogs for Defender for Cloud to ingest the results.
The Break Parameter — Your Enforcement Mechanism
The break parameter is the enforcement lever. When set to true, the MSDO task fails the pipeline build if any high-severity findings are detected. This means:
A PR with a misconfigured Terraform template won’t merge if it introduces a critical IaC finding.
A build that packages a container image with critical CVEs will fail before the image is pushed.
A commit that accidentally includes a hardcoded secret won’t make it past the pipeline.
Start with break: false to get visibility into what’s being detected without blocking developers. Once your team is comfortable with the findings and has reduced the noise, flip it to true to enforce.
Pull Request Annotations
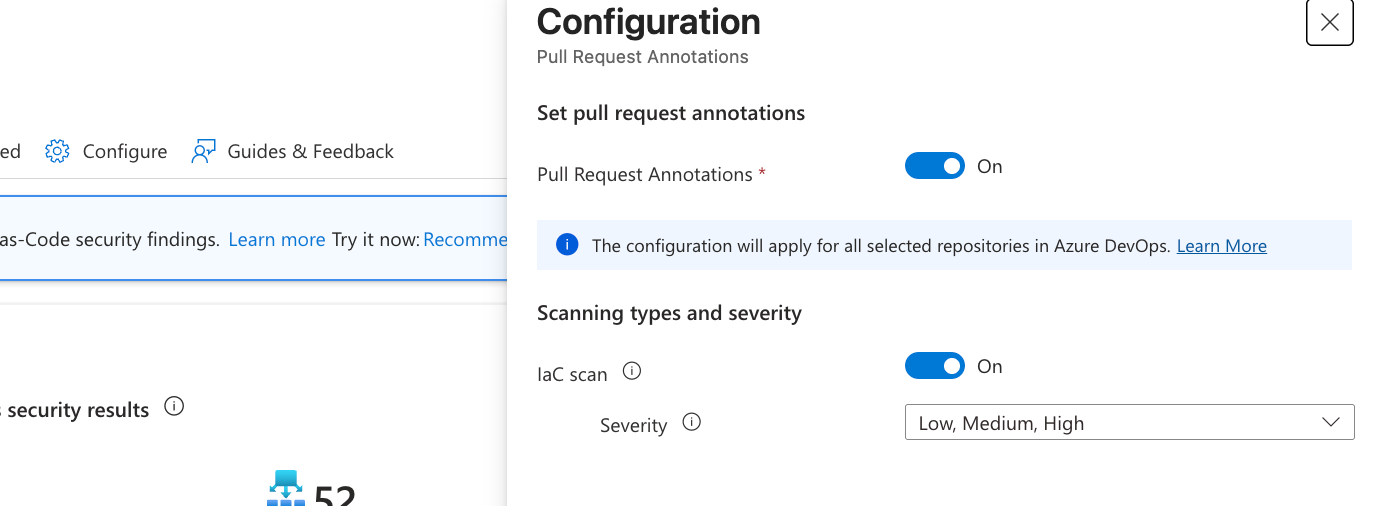
If you’ve enabled Defender for Cloud’s DevOps security capabilities with the Defender CSPM plan, you can also get pull request annotations. This means when a developer opens a PR that introduces an IaC misconfiguration, Defender for Cloud can automatically add a comment to the PR pointing out the issue. The developer sees the finding right in their review workflow without needing to check a separate portal.
This requires the DevOps security connector and appropriate permissions. It’s a powerful way to make security findings actionable without adding friction.
What About the Defender for Cloud CLI?
You might be wondering: what about the new Defender for Cloud CLI that Microsoft has been talking about? Great question. The MDC CLI is a newer, developer-first command-line tool that’s designed as the next evolution beyond MSDO. It focuses primarily on container image scanning using Microsoft Defender Vulnerability Management (MDVM) and works across any CI/CD platform.
We’ll cover the MDC CLI in detail in Part 2 of this series.
If you’re currently using MSDO for IaC scanning, SAST, and dependency analysis, keep using it. If you need container image scanning in your pipeline, the MDC CLI is the direction Microsoft is heading. They complement each other, and understanding both gives you full coverage.
What’s Next
In Part 2, we’ll dive into the Defender for Cloud CLI — what it is, how to install and authenticate it, how to scan container images locally and in CI/CD pipelines, and how results flow back to Defender for Cloud.
In Part 3, we’ll cover Gated Deployment for Kubernetes — using the MDC CLI and Defender for Containers together to enforce security rules at deployment time, blocking vulnerable container images from being admitted into your Kubernetes clusters.
References Microsoft Learn:
DevOps security in Defender for Cloud: https://learn.microsoft.com/en-us/azure/defender-for-cloud/defender-for-devops-introduction
Have blog ideas, want to engage on a topic, or explore collaboration? Let’s take it offline reach out on LinkedIn. I’d love to connect and continue the conversation!