


Defender For Cloud - under the hood: Defender for Servers Health Check Guide
Is your defender for servers deployment healthy?


Thanks for reading along this is part 3 of covering defender for servers if you missed part one and two be sure to go back and read those for more context.
This post will guide you through essential health checks and common troubleshooting steps to ensure your Defender for Servers deployment is robust and providing the protection you expect. I expect to update this post with new scenarios as the solution develops even more.
Why Check Defender for Servers Health?
An unhealthy deployment can mean:
Coverage Gaps: Servers might not be onboarded correctly or agents might stop reporting, leaving them unprotected and invisible to Defender for Cloud.
Missed Detections: If agents aren't communicating or configured properly, vital security alerts and recommendations won't be generated.
Compliance Issues: Many compliance standards require endpoint protection and monitoring. Gaps can lead to non-compliance.
Wasted Resources: You might be paying for licenses on servers that aren't actually benefiting from the protection.
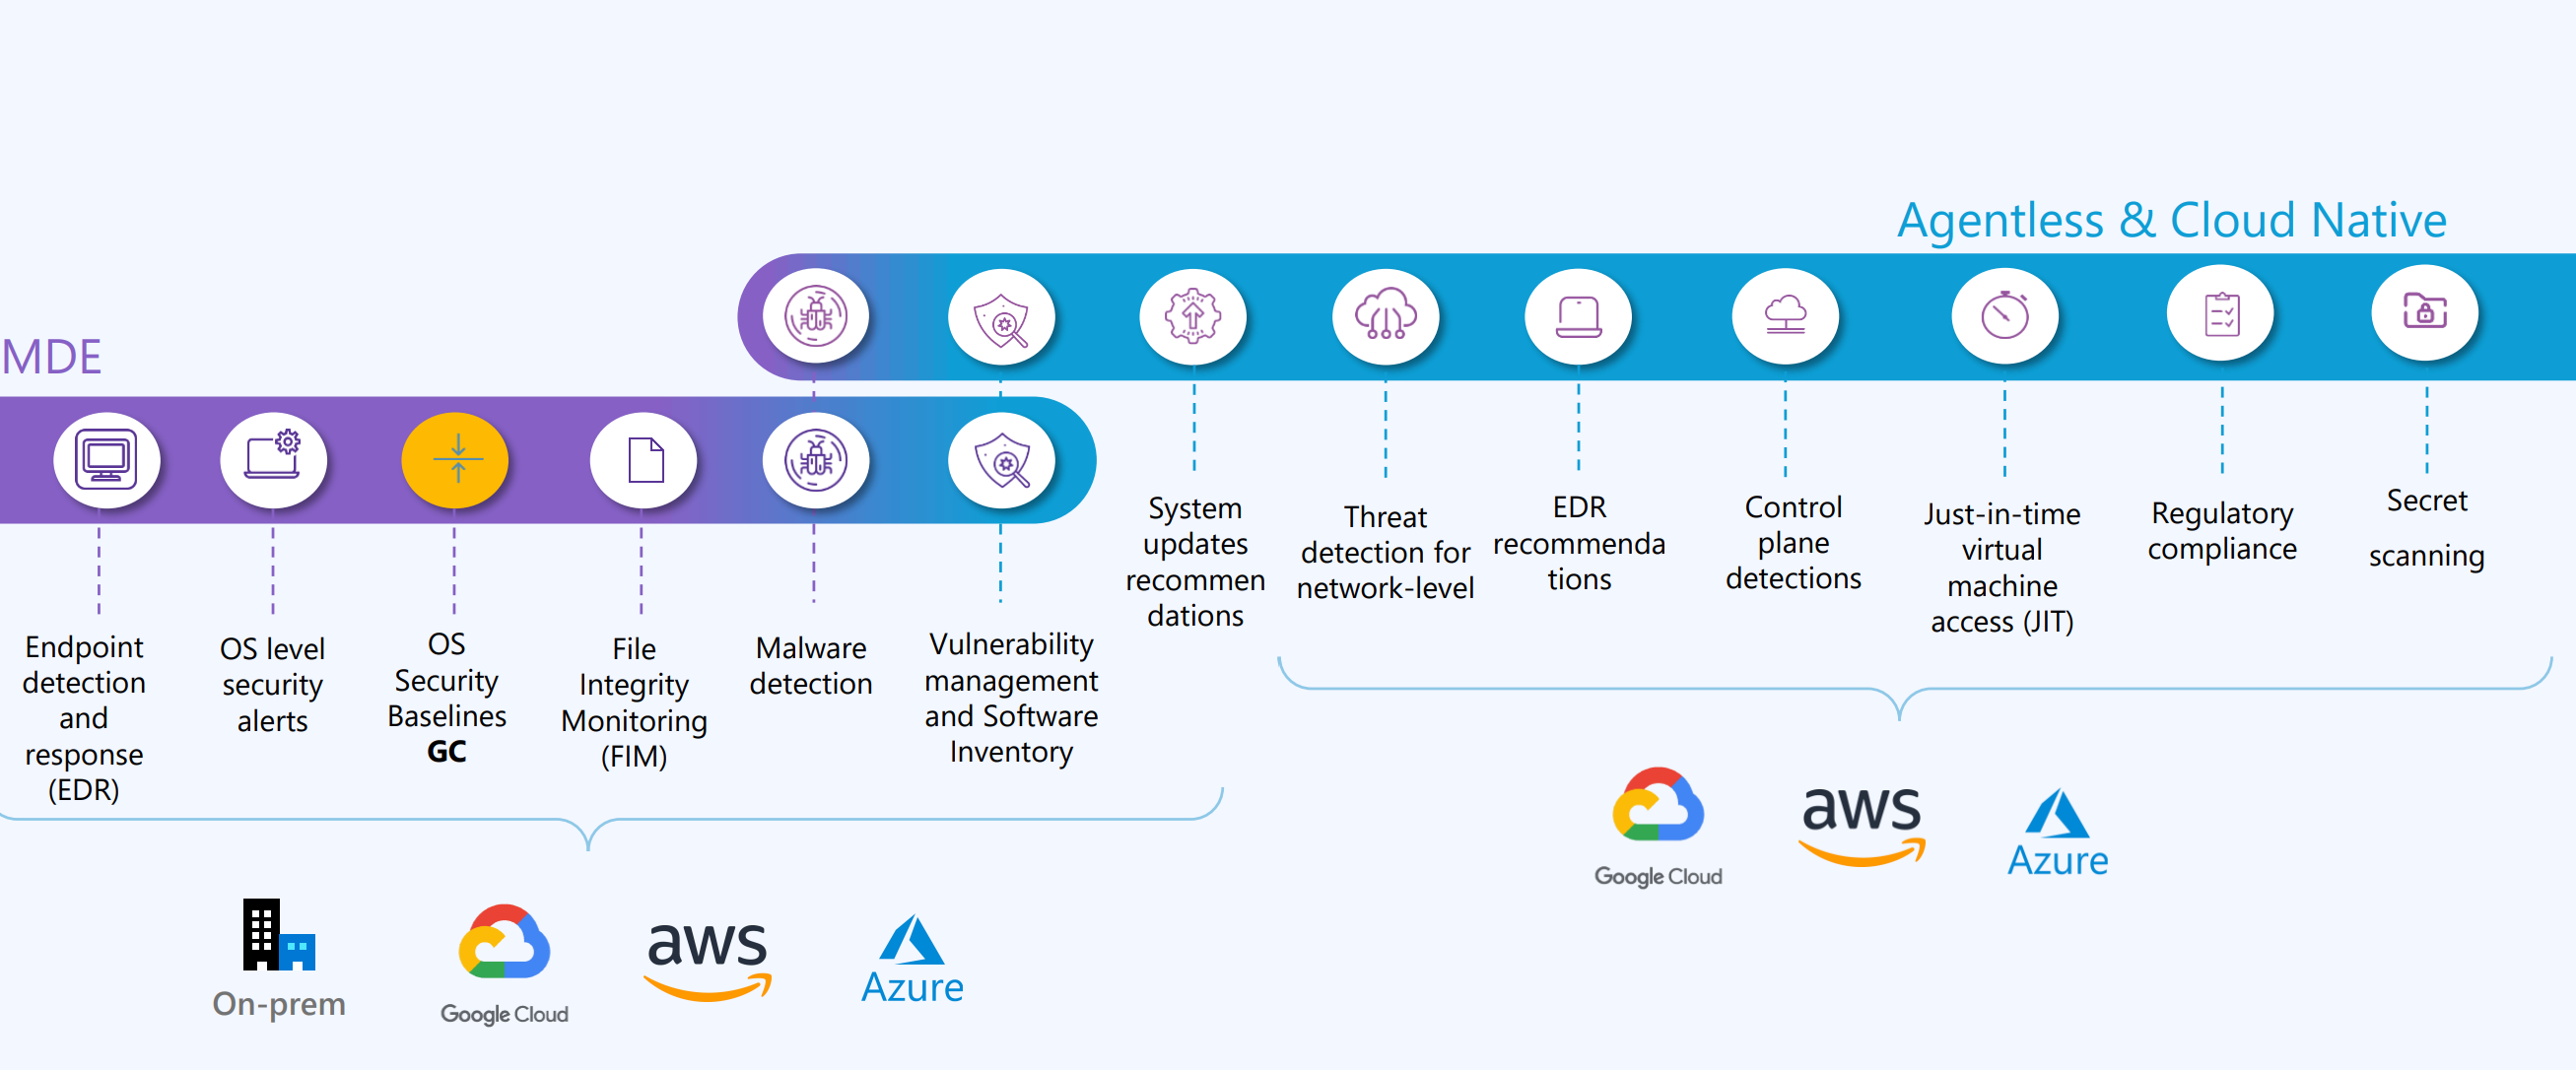
Understanding the Key Components and architecture
Before diving into checks, let's quickly recap the main components involved:
Microsoft Defender for Cloud: The central console in Azure where you manage security posture, enable Defender plans, view alerts, and recommendations.
Log Analytics Workspace: Where security data collected from your servers is stored and can be analysed.
Monitoring Agent (AMA) ( required for plan 2): The agent installed on your servers that collects security events and performance data.
MDE Agent/extension: Enables endpoint detection and response (EDR) ( plan one and two) capabilities from Microsoft Defender for Endpoint.
Azure Arc (for Hybrid/Multicloud): The service that extends Azure management and services (like Defender for Cloud) to servers running outside of Azure. The Azure Connected Machine agent is key here.
Defender for Cloud Extensions: Specific solutions deployed via agents designed to collect data or extend functionality, like integrated vulnerability assessment (Microsoft Threat & Vulnerability Management). You can benefit from Microsoft Defender for Cloud CSPM even if you don’t provision agents. However, for CWP you'll need to install an agent for Defender for Servers Data is collected using:
Azure Arc agent (For multicloud and on-premises servers)
Microsoft Defender for Endpoint extension
Azure Monitor Agent or Log Analytics agent (deprecating)
For other plans and data collection methods click here
What to Look For:
Check 1: AMA Agent health
Are agents installed on desired servers? ( for example in production)
This check is relatively simple you can use azure graph explorer, ARG queries rely on the Azure control plane to see which Virtual Machines (VMs) and Azure Arc-enabled servers have the AMA extension reported as installed. This is good for seeing the desired state or provisioning status of the extension. I’ll include sample queries near the end.
Are agents reporting recently?
You can check Agent Installation status (Extensions blade).
You can check if the agent is reporting recently by querying the
Heartbeattable in Log Analytics.You cannot directly see the agent's service status (running/stopped) from the main portal blades, but the heartbeat query confirms it indirectly.
You cannot directly see a simple "network connectivity OK" status for the agent, but the heartbeat query confirms it indirectly.
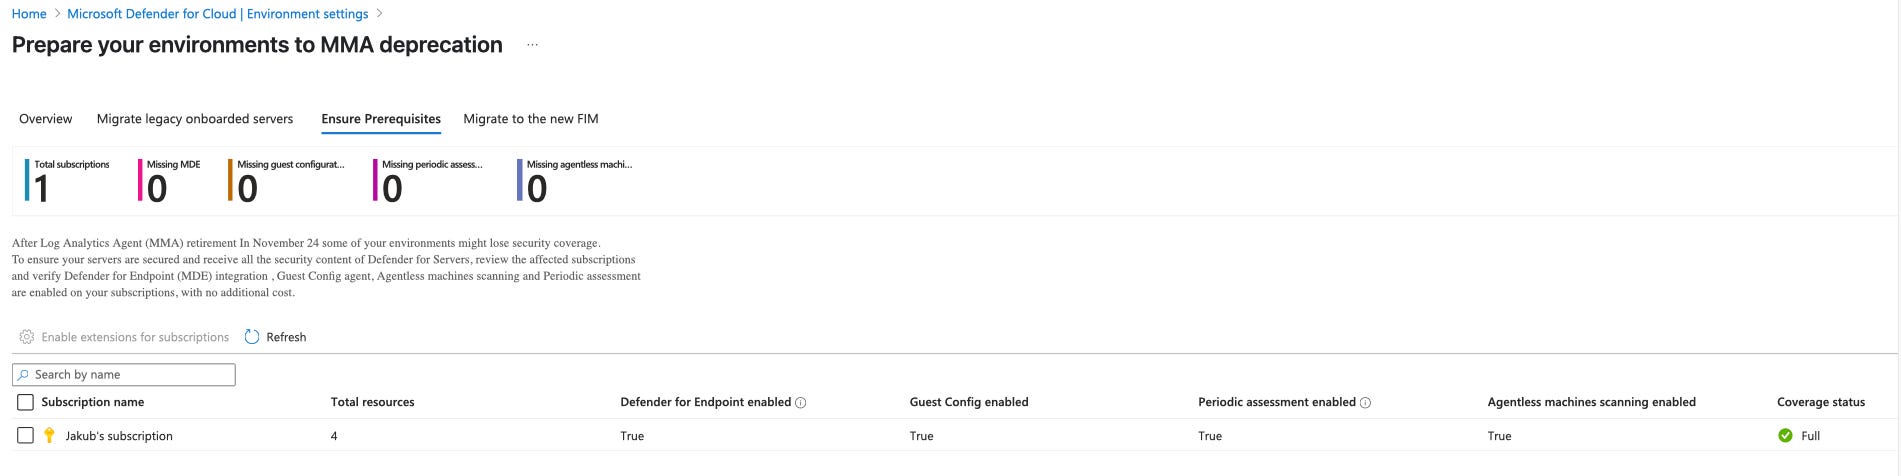
Have you migrated from MMA to AMA? Microsoft have retired the MMA agent and hopefully you have migrated by now….
The portal experience can help verify this claim navigate to defender for cloud > environment settings > MMA migration.
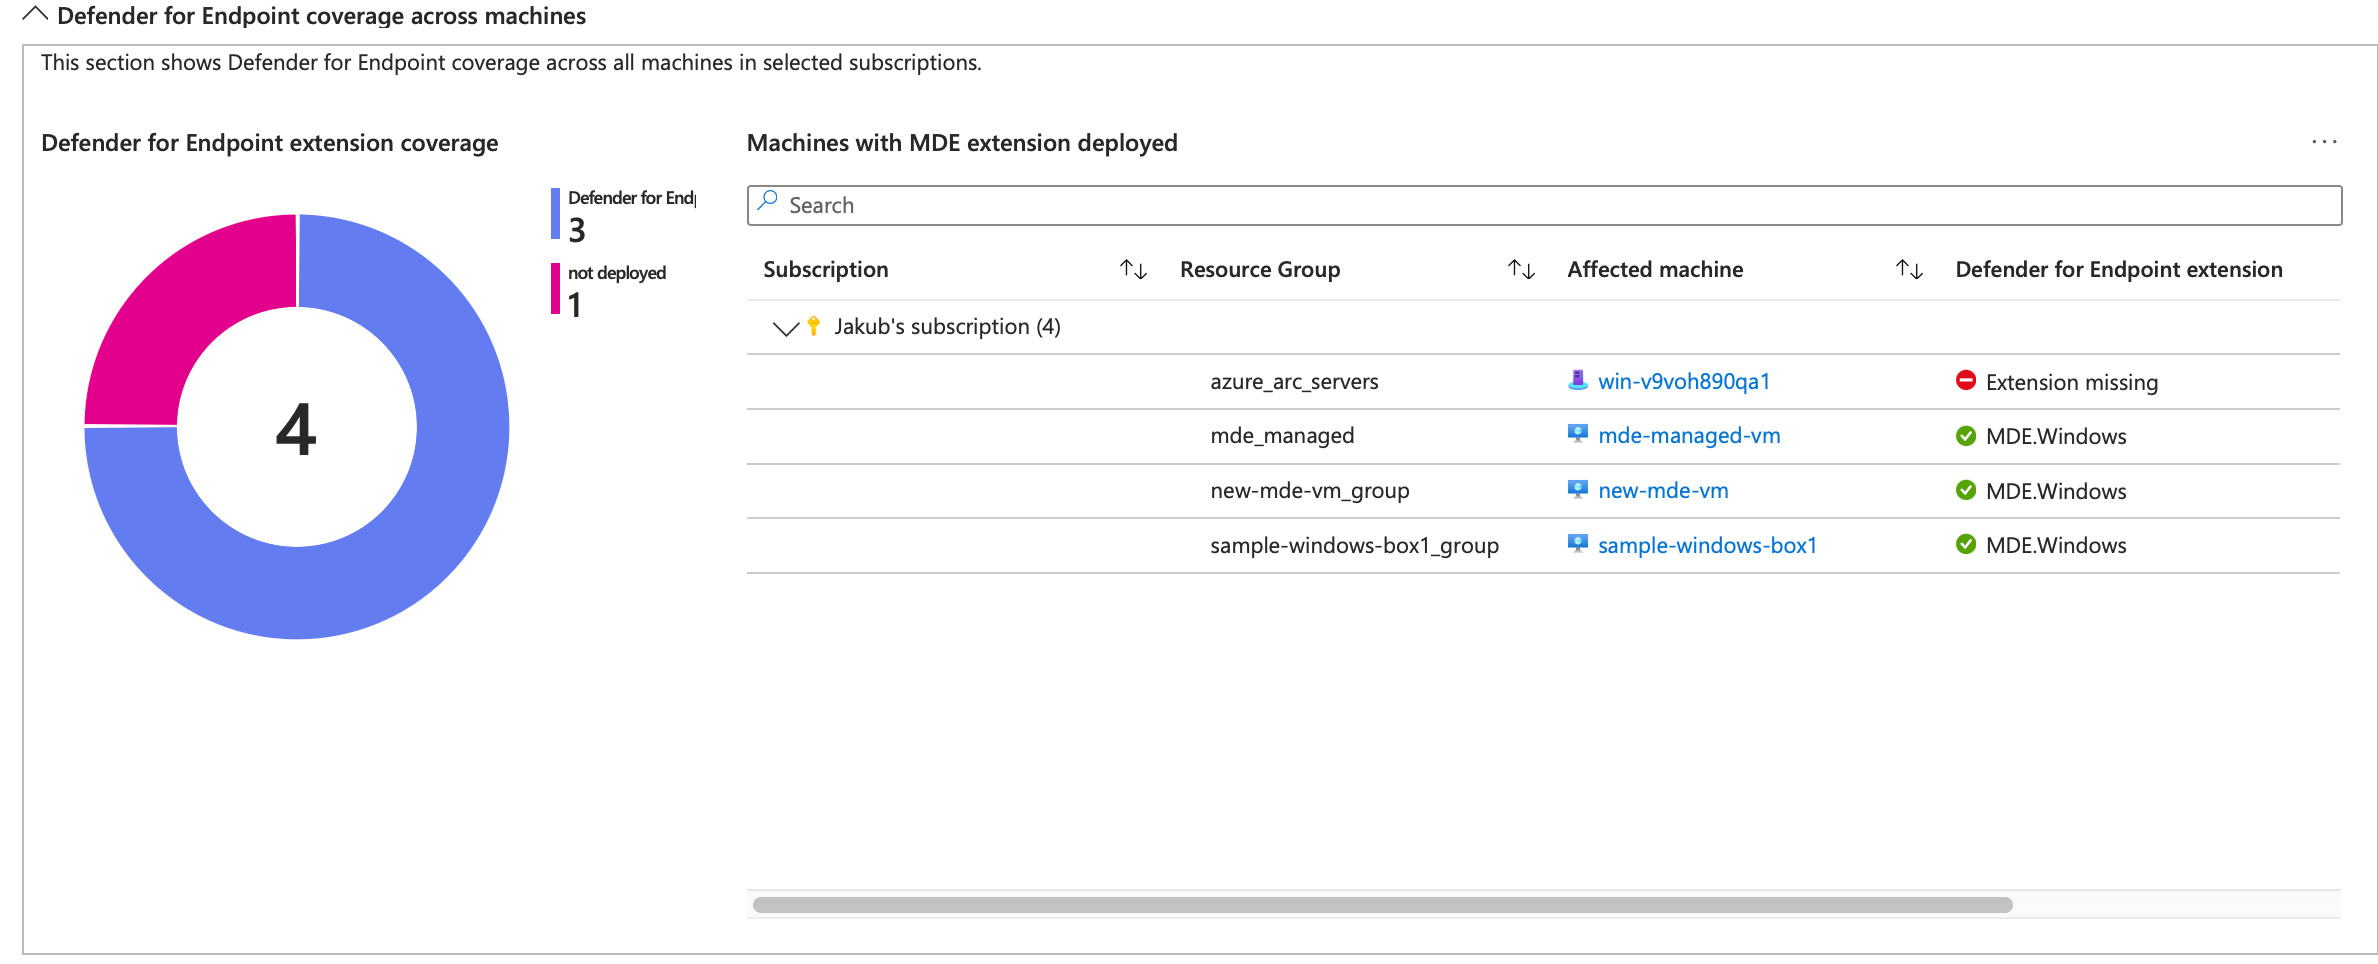
Check 2: MDE Extension health
Applies to servers where you’ve used the onboarding package from the XDR portal.
View device health reports where you’l get detailed data about the MDE sensor health:
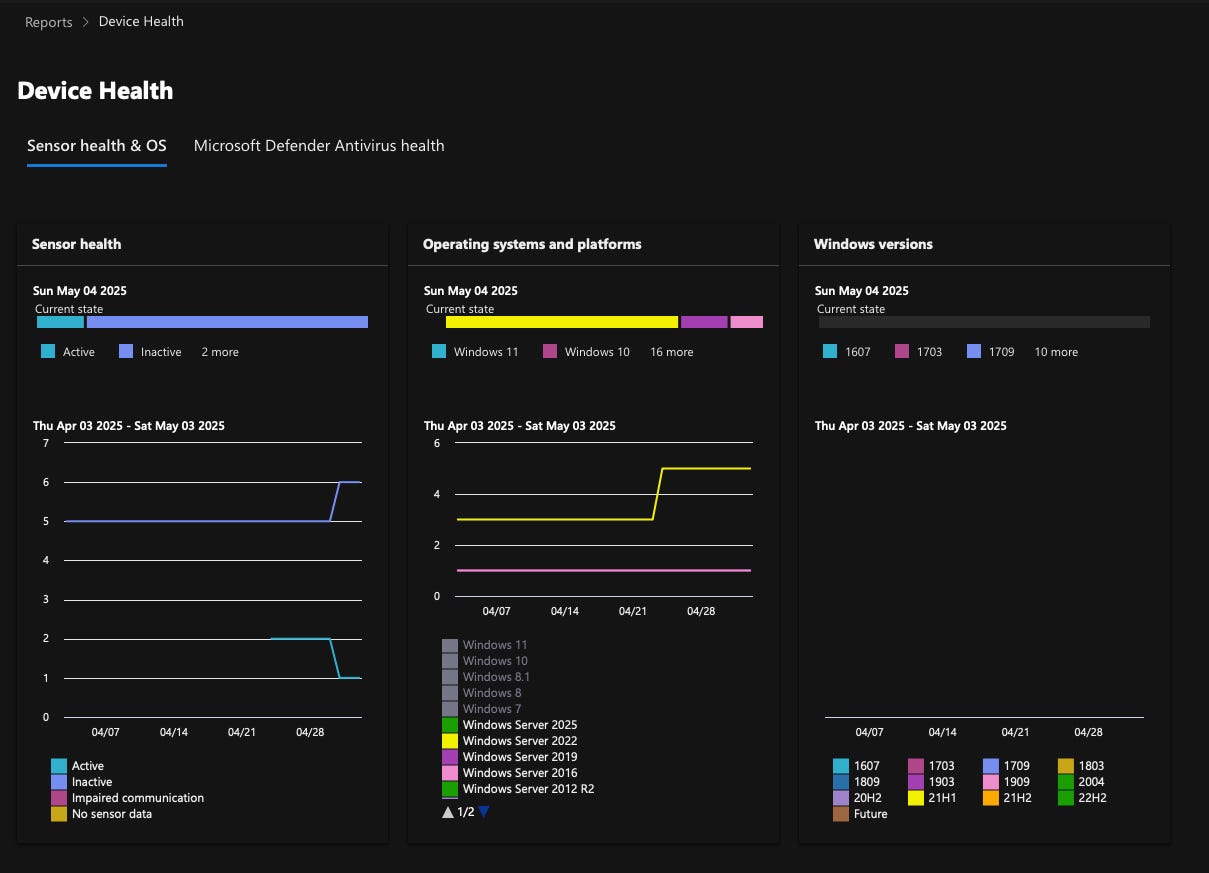
You’ll get at a glance information about onboarded devices with the MDE sensor and its health state by visiting the assets > devices page
Microsoft have a great post on fixing unhealthy sensors check it out here

Finally if you prefer to manipulate the information you want to see you can use KQL to get a list of devices and their sensor status.
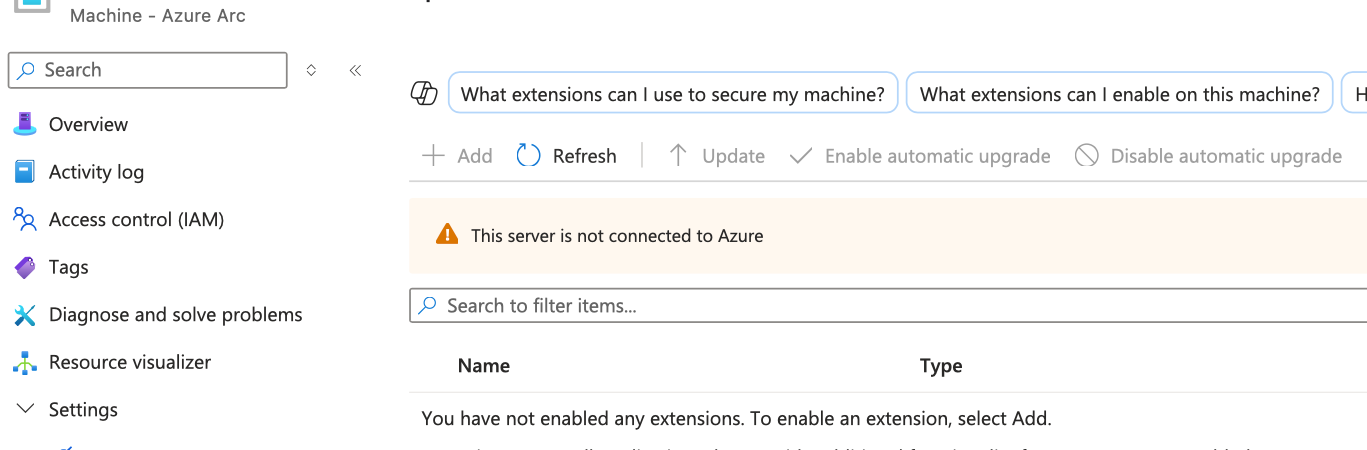
Check 3: Azure Arc Connectivity (for Hybrid/Multicloud Servers)
Where to Check:
Azure Arc -> Servers: Check the "Status" column. It should show "Connected".
What to Look For:
Servers showing "Disconnected" or "Expired". This means the Arc agent isn't communicating with Azure, and therefore, Defender for Cloud isn't receiving data or managing the server effectively just like below which isn’t even recognised as being connected:
For troubleshooting see Microsoft documentation
Ensure direct onboarding is turned on from defender for cloud > environment settings: Defender for Cloud allows you to directly onboard your non-Azure servers by deploying the Defender for Endpoint agent. This provides protection for both your cloud and non-cloud assets under a single, unified offering.
See Microsoft documentation for further reading on thus feature
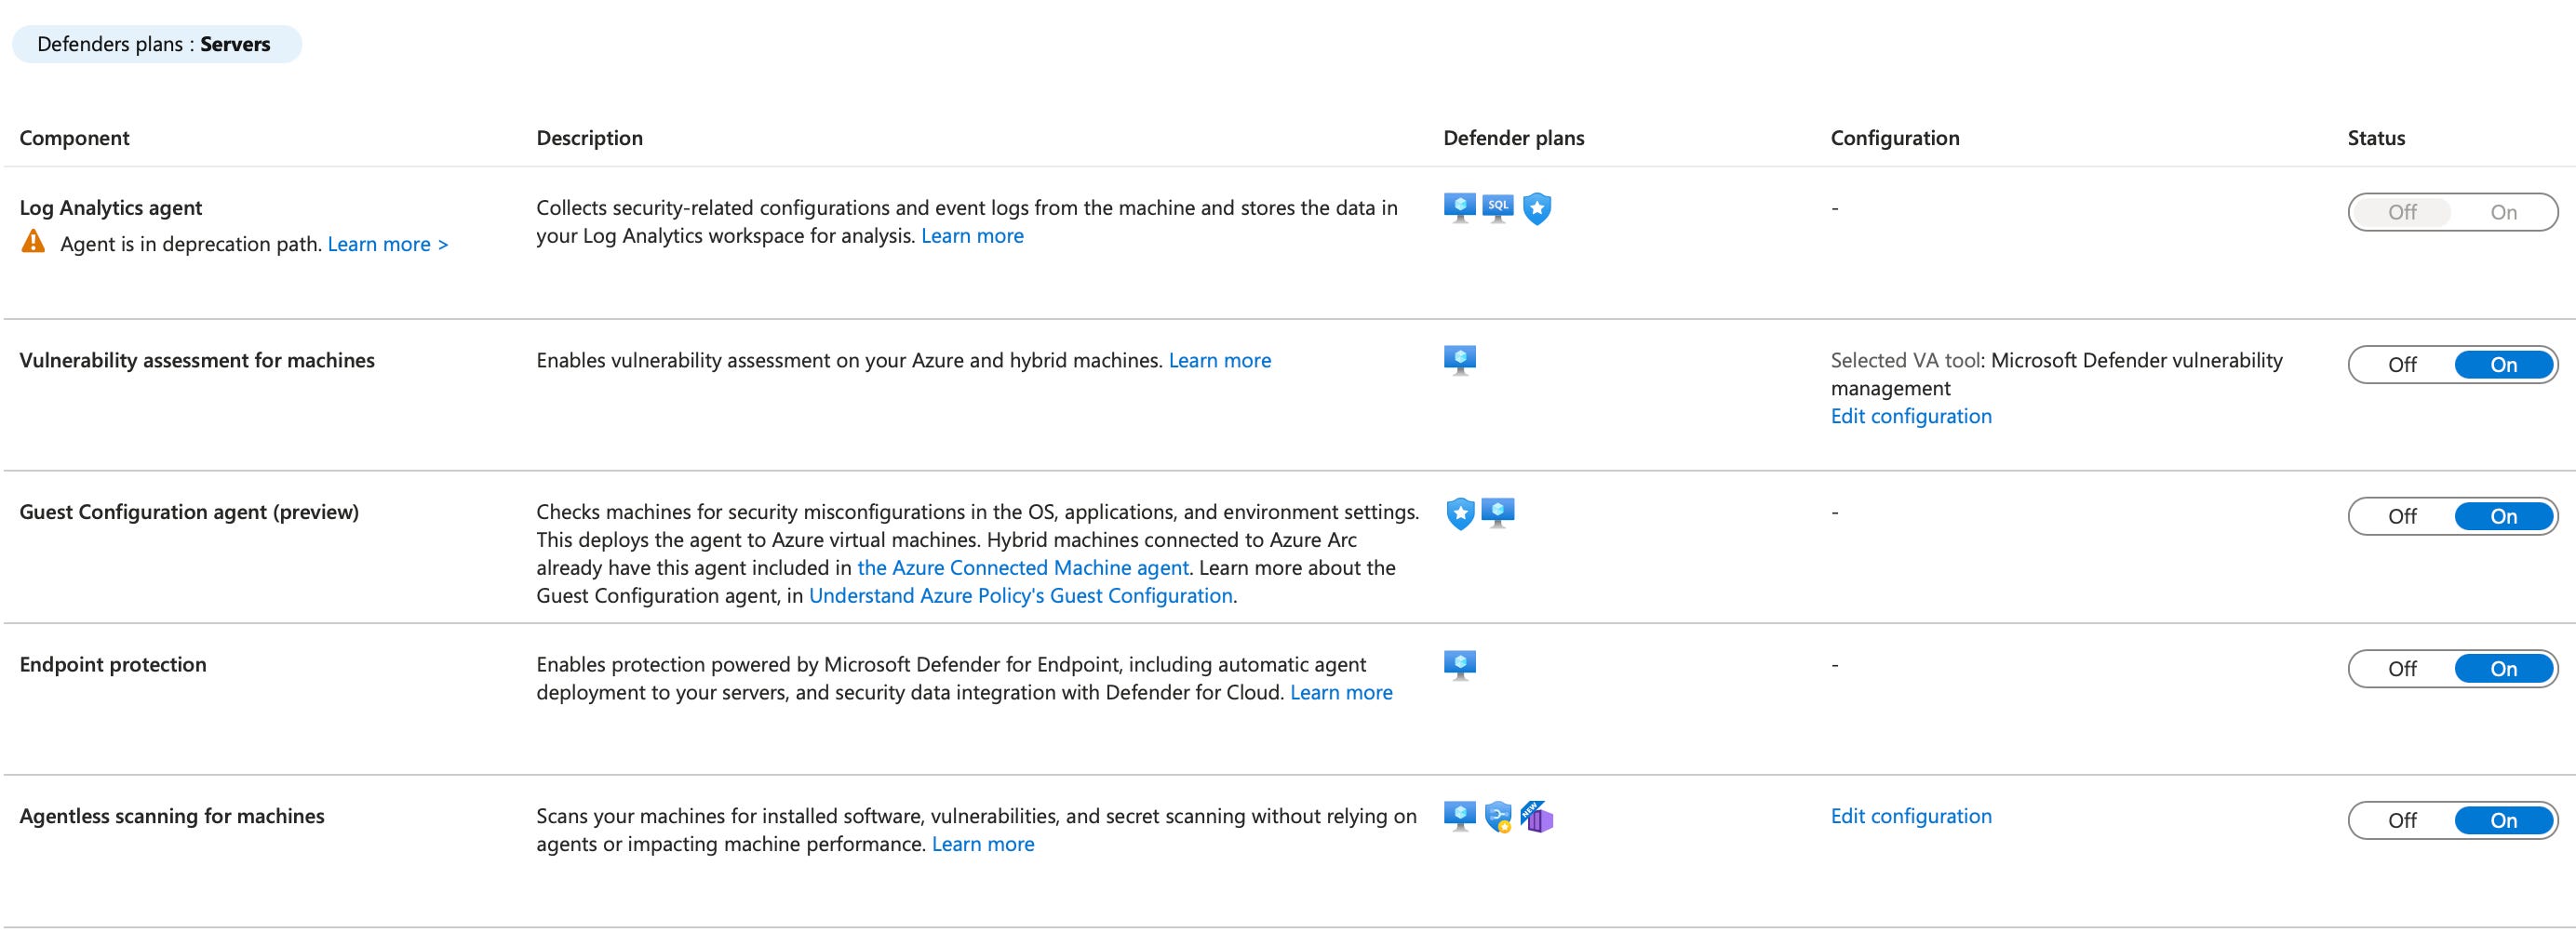
Check 4: Are the Defender for Cloud Plan and extensions on?: Verify that the required plan ( plan one or two) is actually turned on and that the required extensions are also turned on.
Where to Check:
Defender for Cloud -> Environment Settings -> Select Subscription/Workspace: Verify that the "Servers" plan is turned "On" either plan one or two.
Defender for Cloud -> Settings -> Auto-provisioning: Check if auto-provisioning is enabled for the azure monitor agent as well as the other extensions under environment settings > defender plans > defender for servers > settings

Defender for Cloud -> Inventory -> Select Server -> Recommendations: Check if vulnerability assessment results are appearing (e.g., "System updates should be installed on your machines"). If these are missing, the vulnerability assessment setting could be off or the MDE extension might not be running correctly which provides the vulnerability assessment functionality.
Check 4: Review Alerts & Recommendations
Where to Check:
Defender for Cloud -> Security Alerts: Are alerts being generated as expected? Consider running a test alert if needed (Defender for Cloud provides sample alert generation).
Defender for Cloud -> Recommendations: Is the list populated with relevant security recommendations for your servers? Missing recommendations might indicate monitoring or configuration issues.
What to Look For:
Absence of alerts/recommendations where you might expect them.
Stale recommendations that aren't updating.
Troubleshooting Common Problems
Issue: Agent Not Reporting (Stale Heartbeat / Not Installed)
Check Connectivity: Ensure the server can reach required Azure endpoints over HTTPS (port 443). Check firewalls and proxy configurations. (Search for "Azure Monitor Agent network requirements" or "MMA network requirements").
Check Service Status (On the Server):
AMA (Windows): Check the "Azure Monitor Agent" service (
MonAgentCore). Check logs underC:\Resources\Directory\<GUID>\TablesandC:\Resources\Directory\<GUID>\Status.AMA (Linux): Check the
amacoreagentprocess. Logs are typically in/var/opt/microsoft/azuremonitoragent/log/.
Data Collection Rules (AMA): Ensure the server is associated with the correct DCRs in Azure Monitor and that the DCRs are configured to collect the expected data (e.g., security events).
Reinstall Agent: As a last resort, try reinstalling the agent.
Issue: Azure Arc Agent Offline
Check Connectivity: Ensure the server can reach Azure Arc endpoints. Check firewalls/proxies. (Search for "Azure Arc network requirements").
Check Service Status (On the Server):
Windows: Check the "Azure Hybrid Instance Metadata Service" (
himds).Linux: Check the
himdsdservice.
Check Agent Logs: Logs are typically under
C:\ProgramData\AzureConnectedMachineAgent\Log(Windows) or/var/opt/azcmagent/log(Linux).Re-register: You may need to run
azcmagent disconnectand thenazcmagent connectagain.
Issue: Defender Plan/Features Not Enabled on Server
Check Licensing & Scope: Ensure the Defender for Servers plan is enabled on the subscription or workspace connected to the server (Environment Settings).
Check Auto-provisioning: If relying on auto-provisioning, ensure it's correctly configured for the required agents/extensions.
Policy Compliance: Sometimes Azure Policy assignments can interfere. Check relevant policy assignments and compliance status.
Workspace Connection: Ensure the server is reporting to a Log Analytics workspace that is enabled for Defender for Cloud security solutions.
Proactive Monitoring
Don't just wait for things to break!
Azure Monitor Alerts: Set up alerts based on the
Heartbeattable in Log Analytics to notify you proactively when servers stop reporting.Defender for Cloud Workbooks: Utilize built-in workbooks (like "Agent Health Status") or create custom ones to visualize agent health across your environment.
Regular Reviews: Schedule time (weekly/bi-weekly) to run through the health checks outlined above.
KQL and ARG queries:
KQL query to find the reporting status of an AMA ament:
Heartbeat
| where TimeGenerated > ago(1h) // Check for heartbeats in the last hour
| where Computer == "<Your_Machine_Name>" // Filter for a specific machine
// | where Category == "Azure Monitor Agent" // Optional: Filter specifically for AMA
| summarize LastHeartbeat = max(TimeGenerated) by Computer, Category, OSName, OSType, Version
Basic Query Azure Graph Explorer to find Virtual Machines with the Azure Monitor Agent Installed for check 1:
// Basic Query: Find Azure VMs with the AMA extension
Resources
| where type == 'microsoft.compute/virtualmachines'
| extend vmExtensions = properties.instanceView.extensions // Get the runtime extensions list
| mv-expand vmExtensions // Expand the list so each extension is a row
| where tostring(vmExtensions.name) in ('AzureMonitorWindowsAgent', 'AzureMonitorLinuxAgent') // Check the 'name' of each extension
| project name, resourceGroup, location // Show minimal details
| distinct name, resourceGroup, location // Get unique VMs (since mv-expand might create duplicates if other extensions exist)
| order by name asc
Get A list of Azure Arc Machines for check 1:
// Query A: Find specific Arc-enabled machines
Resources
| where type == 'microsoft.hybridcompute/machines'
// | where name == '<YourArcMachineName>' // Optional: Filter for your specific machine name if you know it
| project name, resourceGroup, location, properties.status, properties.osName, properties.agentVersion, properties.lastHeartbeat
Basic Query to find Hybrid machines Machines with the AMA agent for check 1:
// Basic Query (Corrected v2): Find Arc-enabled Servers with the AMA extension
Resources
| where type == 'microsoft.hybridcompute/machines'
| mv-expand arcExtension = properties.extensions // Expand the list of extensions, renaming for clarity
| where tostring(arcExtension.properties.type) in ('AzureMonitorWindowsAgent', 'AzureMonitorLinuxAgent') // Check the 'type' within the nested 'properties' object
| project name, resourceGroup, location // Show minimal details
| distinct name, resourceGroup, location // Get unique servers
| order by name asc
Workbooks - Defender for Servers Deployment Status
Credits to: Tom Janetscheck for creating this workbook! The Defender for Servers Deployment Status workbook provides a clear overview of the deployment status of key components in Microsoft Defender for Servers see the full breakdown here. I highly recommend you deploy it and tweak it to your needs.
Have blog ideas, want to engage on a topic, or explore collaboration? Let’s take it offline reach out on LinkedIn. I’d love to connect and continue the conversation!