


Defender For Cloud - under the hood: Resource Inventory Deep Dive
Understand the value of Defender For Cloud assets inventory and how it works under the hood

Hey your security team called… ☎️ they’re frustrated with managing endless tools and not getting any proper visibility. Defender for Cloud can help, in this blog you’ll learn all about asset inventory.
‼️) This blog is part of a Defender For Cloud "Under the hood series" where we explore the various features, benefits and considerations that come with implementing Defender For Cloud (and other CNAPPs). You don't need any prior experience just a willingness to learn and develop. I don't quite know when the series will end but I hope you enjoy.What is resource inventory
Simply put, the Defender for Cloud asset inventory page is a centralised pane of glass that provides unified, end-to-end visibility of all your resources across multi-cloud and hybrid environments. So, how does the magic happen? Once you enable Defender for Cloud CSPM or Foundational, Defender will, by default, use an agentless approach to onboard all your cloud resources (VMs, containers, storage accounts, and more). Within a few hours of setup, you'll have a comprehensive view of your environment. An agentless approach is the way to go (in my opinion, anyway!). But if you need an agent, there’s always an option for that too more on that later.
Understanding the asset Inventory pane
Once you click into Resource Inventory, you’ll see a shiny dashboard—but before you start clicking around, let’s break it down bit by bit and understand what each segment means!
Azure Resource Graph and Searching for data at scale

Header Section
Starting from the top, you’ll see your standard banner, but I want to highlight something—the “Open Query” field. Did you know that Defender for Cloud integrates with Azure Resource Graph (ARG)? Well, now you do! Resource Graph enables you to query data at scale across your environments, helping you quickly retrieve the information you need.
What else supports querying data at scale? Kusto Query Language (KQL). By combining Azure Resource Graph (ARG) and KQL, you can maximise the value of your Asset Inventory.
You might ask, "Why use ARG if the dashboard already displays all the data?"
Here’s a simple use case:
Let’s say you need specific data in a custom format (such as graphs). The pre-built filters in the dashboard only offer so much flexibility. With ARG and KQL, you can define the output on your own terms, ensuring you get exactly what you need.
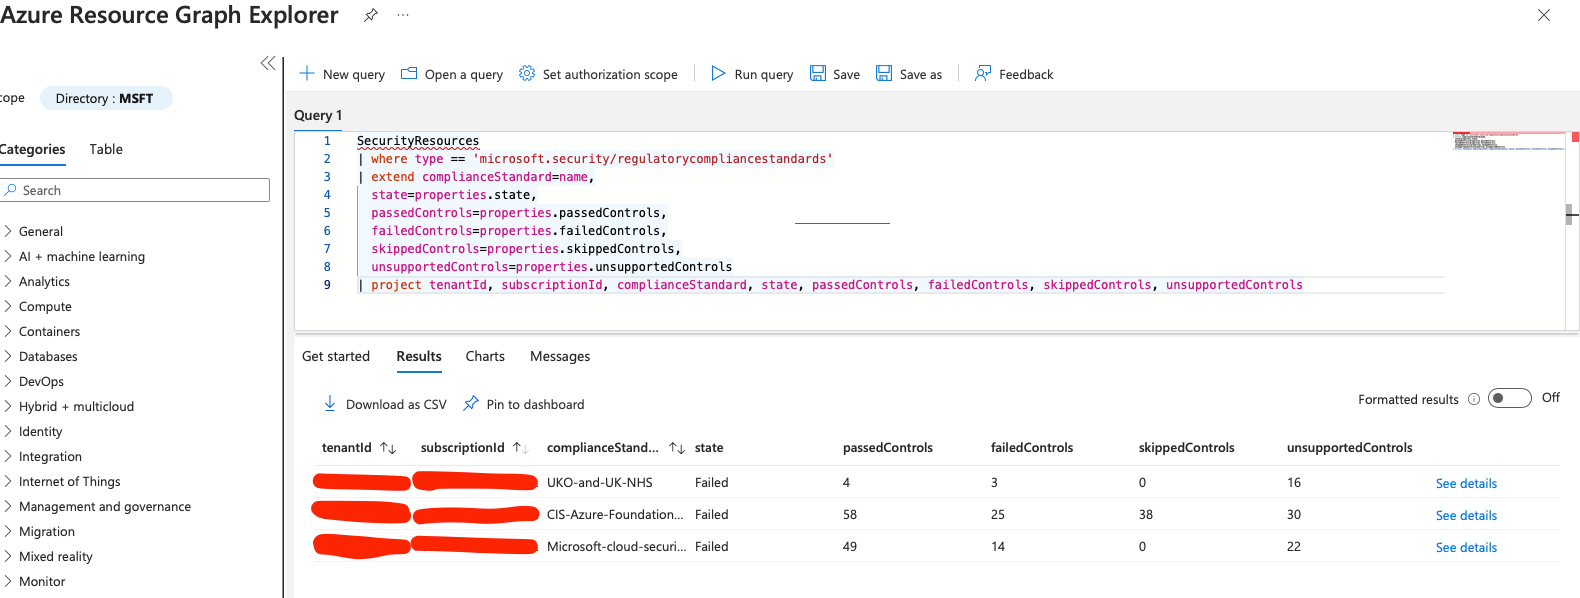
Plus, there are plenty of pre-built queries available. Let’s take a look at a basic one that retrieves and filters regulatory compliance states per compliance standard, per subscription.
I have a demo environment with one subscription, but imagine an enterprise environment with 70, 80, or even 100 subscriptions ARG makes managing that scale much easier!
Another simple query below generates a basic list of installed software across your resources. This can be useful in scenarios where you're looking for specific data—which can then be filtered down even further.
Now, consider this scenario:
A specific software version is found to be vulnerable, and you need a list of assets running that exact version. With Azure Resource Graph and KQL, you can quickly identify affected resources, enabling a faster response to potential security risks.
securityresources
| where type == "microsoft.security/softwareinventories"
| project id, Vendor=properties.vendor, Software=properties.softwareName, Version=properties.version
Now, of course, I’m using a demo environment, so this isn’t the most exciting query but you should now have a clear understanding of how Azure Resource Graph can be used at scale with Defender for Cloud. It’s a really handy feature!
I encourage you to explore and experiment with this feature if you’re able to. I’ll also include some handy KQL training guides near the end in case you need to brush up on your skills.
Overview of azure resource graph
Total resources & Unhealthy resources
Moving on, you’ll also see the “Total Resources” and “Unhealthy Resources” sections. Let’s break down what they are and how they work.
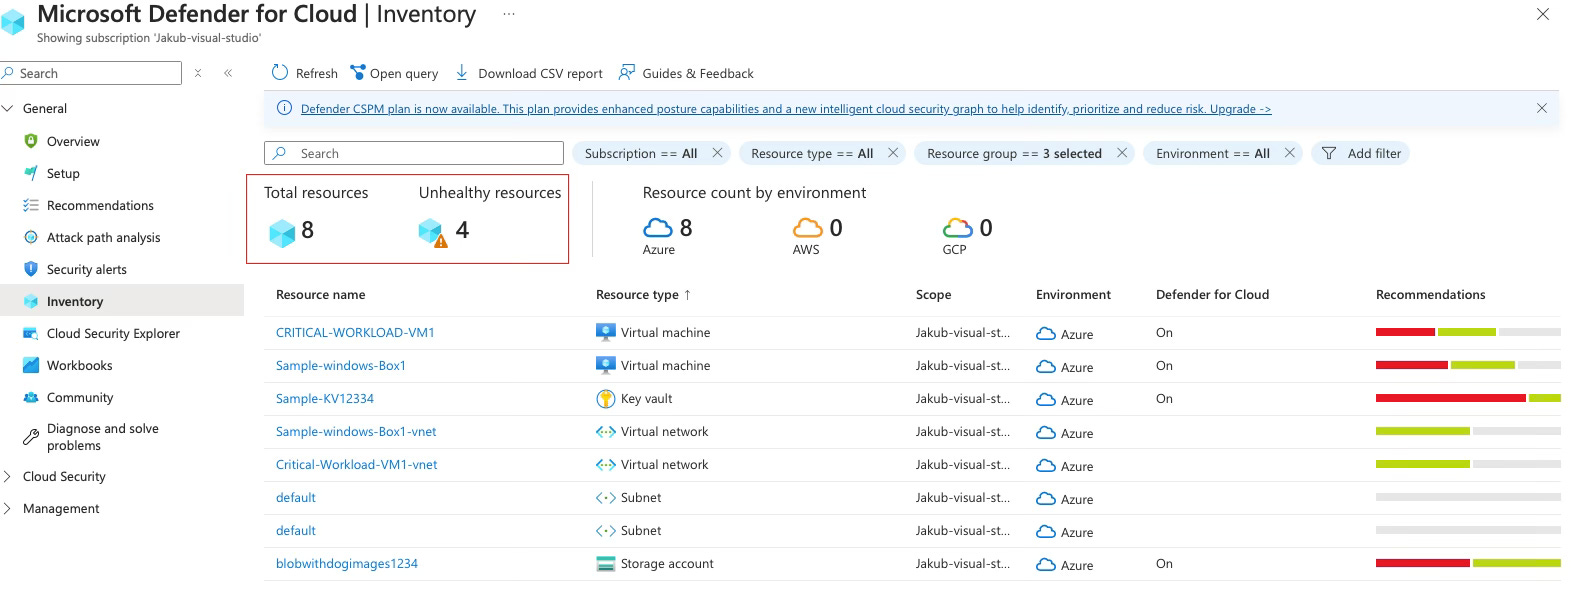
Total resources: Based on the filters you’ve selected, you’ll see a “Total Resources” count. This number represents resources filtered from your resource groups, Azure subscriptions, and other environments (e.g., GCP, AWS, and on-premises assets). On-premises assets, such as VMs, will be included if they are properly onboarded—for example, via Azure Arc.
Unhealthy Resources: These are resources that have at least one security recommendation requiring attention. Resources may be flagged as unhealthy due to:
Misconfigurations (e.g., exposed network ports, VMs missing Defender for Endpoint)
Vulnerabilities (e.g., unpatched OS, weak authentication settings)
Non-compliance with security best practices (e.g., weak encryption being used)
What does CSPM have to do with total resources and unhealthy resources?
Cloud Security Posture Management (CSPM) provides end-to-end visibility across all your environments and resources, regardless of where they reside. CSPM operates using agentless scanning, where workloads are discovered via API calls made to the cloud service provider (CSP). This process queries the resources and automatically updates the inventory, marking resources as unhealthy when vulnerabilities or misconfigurations are detected. This is a high-level explanation—for a deeper dive, check out: What is CSPM in Detail?
I wanted to highlight this because CSPM is leveraged "under the hood" to update resources and their state within Defender for Cloud. Both CSPM Foundational and Defender for Cloud CSPM (Paid) provide this functionality, but the paid plan includes additional features such as risk prioritisation and the ability to add custom compliance and best practice standards. Ultimately, CNAPP works best as a unified solution the more context, the better.
How often are my resources discovered?
Azure resources are synced to resource inventory in “near real time” according to documentation ( from experience usually around 30 minutes to an hour).
Recently the scan interval options for cloud connectors associated with AWS, GCP, Jfrog, and DockerHub have been revised. The scan interval feature allows you to control the frequency at which the Defender for Cloud initiates a scan of the cloud environment to discover new and unhealthy resources. You can set the scan interval to 4, 6, 12, or 24 hours, when adding or editing a cloud connector. The default scan interval for new connectors continues to be 12 hours. Read more about this update here we’ll dive deeper into onboarding resources in later blogs on this series.Resource Count By environment
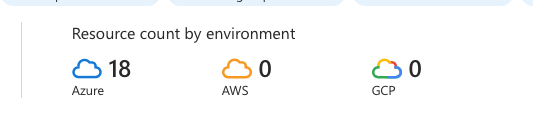
Self explanatory, I don’t have an additional environment onboarded at the moment however resources from additional clouds would show up as a total figure based on the sleeted filters.
Drilling down into resources
Once you click into a resource from the inventory dashboard you’ll see a number of tabs let’s focus and drill down in on the left hand side where you’ll see a snapshot of the selected resource.
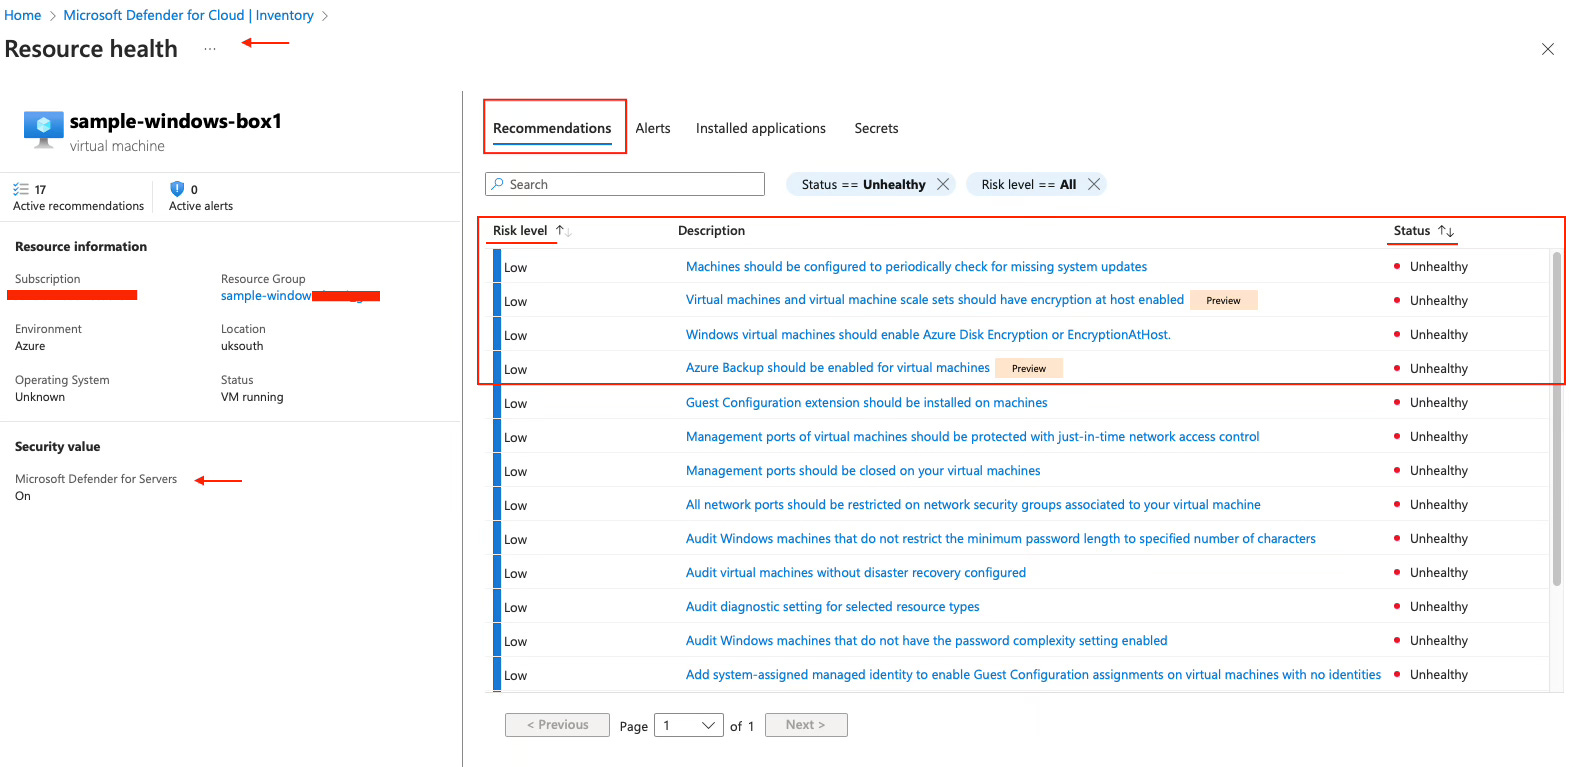
Active Recommendations are suggestions that can be implemented to improve your security posture and reduce your attack surface. So, where do these come from? They stem from industry best practice frameworks, such as the MCSB, or compliance frameworks like PCI DSS, which I have enabled in my Azure tenant. To simplify: these frameworks have a set of controls (pre-set configuration requirements) that need to be enforced in order to pass the control and contribute to the overall compliance state against a specific compliance or best practice standard.
We’ll go deeper into this feature in the Defender for Cloud "under the hood": Recommendations Deep Dive. For now, just keep in mind the context.
Software inventory: Shows a list of all the installed applications on the resource, in this case a virtual machine (VM)
To access the software inventory, you need one of the following plans:

Agentless machine scanning from Defender Cloud Security Posture Management (CSPM).

Agentless machine scanning from Defender for Servers P2.

Microsoft Defender for Endpoint integration from Defender for Servers.
Secrets: Microsoft Defender for Cloud provides secrets scanning in a number of scenarios, including scanning for machine secrets which is what we see here under secrets. A machine secret is any sensitive piece of information stored on a machine (server, VM, or endpoint) that can be used for authentication or access control. Examples include:
🔑 API Keys – Hardcoded keys for accessing services (e.g., Azure, AWS).
🔒 Passwords – Stored credentials in configuration files or scripts.
🔑 SSH Private Keys – Used for secure remote access.
📜 Database Connection Strings – Credentials stored in config files.
I currently don’t have any secrets stored on machines, but if I did, I’d be able to see them here. There’s a lot to unpack in terms of the functionality, so this will be covered in another blog in the series if you’re curious about how secret scanning works. For now, just understand that it’s there, and it’s powered by Defender for Cloud CSPM and agentless scanning.

Reference:
Learn about KQL - A book by Rod Trent Must Learn KQL
Defender For Cloud GitHub Labs
Defender for Cloud Feature requests
Defender for Cloud in the field show
Defender For Cloud Ninja training
Have blog ideas, want to engage on a topic, or explore collaboration? Let’s take it offline reach out on LinkedIn. I’d love to connect and continue the conversation!